Li == Fe + Cu or Zn + Al
I had this in my drafts and decided it's about time to hit publish. Apologies for the incoherent nature. As the saying goes, "I would have written a shorter letter, but I did not have the time".
Return to Fundamentals
As we look at lithium we need to figure out if Lithium will be like Iron Ore & Copper. These commodities have average EBITDA that are high and the price rarely dips below the C1 cash cost of the middle of the cost curve. Or will lithium become more like Zinc and Aluminum with much lower average margins and price semi-regularly going below the middle of the cost C1 cash cost curve.
https://s-i-a.ch/wp-content/uploads/dlm_uploads/2019/09/03-Metals-and-Mining-Bernstein_Paul-Gait.pdf
There isn't much of an established cost curve, with many producers being new and countries like Chile completely re-negotiating the economics. We also don't have good data on the cost of Chinese lepidolite or Zimbabwe spodumene. So this exercise is a speculative one, but let's do it anyway.
West Supplying East Demand
India and China make up 35.17% of global population. They also have GDP per capita growing at a faster rate than the west, coming from poverty and playing catch-up to western levels of industrialization.
Meanwhile the companies we are investing in tend to be listed in Australia, Canada, USA, or England and don't have mines in China or India.
| Iron | Copper | Nickel | Zinc | Al | Lithium | |
|---|---|---|---|---|---|---|
| China + India % global supply | 37% | 7.8% | 3% | 39% | 62% | 13% |
| 30-Year EBITDA Margin | 48.4% | 48.2% | 40.8% | 29.4% | 24.4% | ? |
| Average C(90) premium | 42% | 9% | ? |
It's a small sample size with questionable data. China lepidolite ramped such that 13% is probably understating China's domestic lithium production for example. However, the two highest domestic share in the list are also the two worst returns so there is some credibility to this theory. It's not the only factor however, as Iron and Zinc have very similar domestic share but Iron has been way more profitable than Zinc. Also Iron and Copper domestic share are night and day but both have great profitability.
Recycling
Maybe it's the case that metals with high recycling rates have recycled metal suppressing that peak.
| Iron | Copper | Nickel | Zinc | Al | Lithium | |
|---|---|---|---|---|---|---|
| Recycling % of production | 40% | 32% | ? | 15% | 32% | ? |
| % of scrap recycled | 60% | 40% | 68% | 60% | 76% | ? |
| 30-Year EBITDA Margin | 48.4% | 48.2% | 40.8% | 29.4% | 24.4% | ? |
| Average C(90) premium | 42% | 9% | ? |
This data is all questionable. But overall it shows that Zinc has one of the lowest percentage of recycling and is still one of the least profitable metals. If we look at the percentage of scrap recycled copper and iron come in at the lower end, especially copper.
So while recycling certainly impacts the price cycle it doesn't seem to be a major driver of raw material mining profitability.
Lead Times
If prices are high maybe new mines can be brought on faster in one commodity versus another?

The differences here are pretty tiny, with copper and Zinc essentially the same lead times.
Flat Curves
If you look at the cost curve for iron ore like say this one from 2021:
there are a few things that jump out at you. If you add up the biggset : Rio Pilbara, BHP Western Australia, & Vale you get about half the world's production and make up roughly the bottom half of the cost curve. If you add in China Coastal and FMG the top 5 biggest in the chart dominate. The high cost 1/3 are all small producers and the cost curve goes from flat to steep there. The entire 4th quartile is steep and way above the mean cash cost. The bottom of the cost curve to the top is like 5x.
If we look at Bauxite (Aluminum) costs it's gently sloping so that there are barely any really significantly higher cost producers. Also the bottom of of the cost curve to the top is like 2x.
https://wcsecure.weblink.com.au/pdf/MMI/02829156.pdf
Zinc is even more of a mess as the cost curve has so many producers they sometimes put the x axis of the cost curve graph on a log scale. Zinc usually is found with lead or copper, making the mines less sensative to the price of the individual metal.
It's worth noting that the cost curve is as much about the total level of global demand than it is about the supply. If we took that iron ore curve and had 50% as much production because there was 50% as much demand worldwide we'd see a very flat curve.
Lithium Curves
It's worth saying that a cost curve is at a given point in time at a given production volume. If you grow demand volume 15% a year you need to double production in 5 years. If you grow demand 25% per year you need to triple production in 5 years.
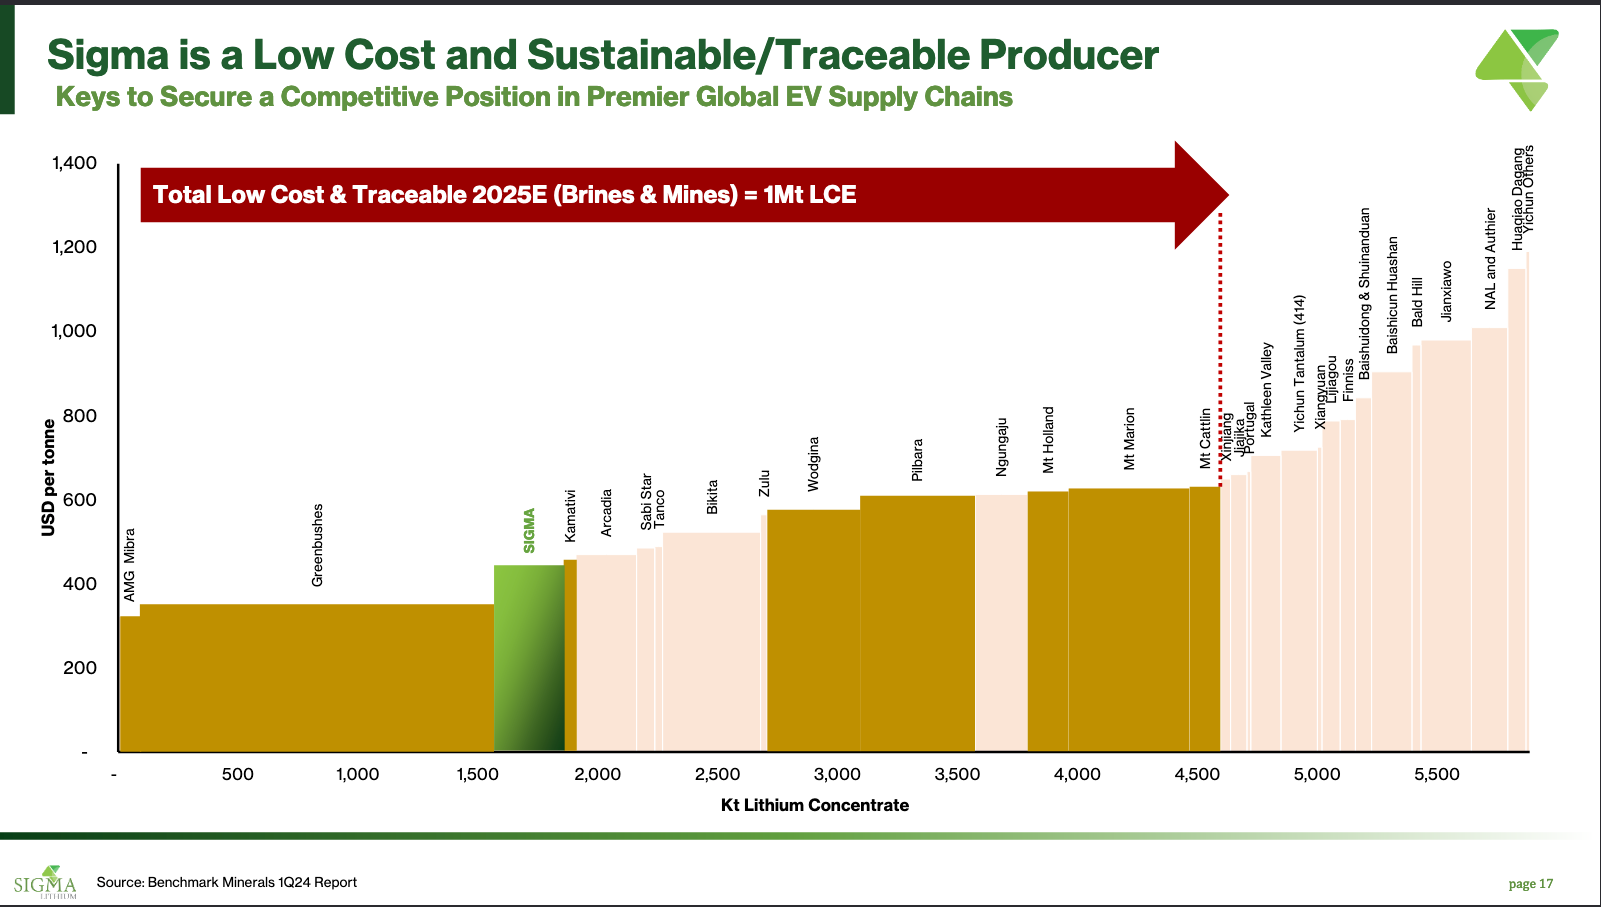
This chart includes spodumene and lepidolite. It's not clear that it adjusts properly for value of concentrate or ocean freight, but it's a good starting point to understand lithium costs.
Zimbabwe numbers are a bit opaque but Benchmark took a shot here putting estmates for Sabi Star, Zulu, & Bikita. The Zimbabwe mines are producing spodumene concentrate that seems cost competitive with other spodumene mines worldwide.
Benchmark data puts all the Chinese lepidolite mines in the top quartile. Also in that top quartile are several high cost spodumene mines. Core's Finiss has stopped mining. NAL have been bleeding cash. If these numbers are correct Minres' Bald Hill and Liontown's Kathleen Valley have to be feeling a lot of pain.
What this hard rock concentrate cost curve doesn't take into account however is brine and vertical integration.
Here's a 5 year old cost curve comparison of brine and hard rock.

It's interesting that on a raw cash costs per lithium ion pulled out of the ground hard rock spodumene actually came in as lower cost than brine. Part of that is that in 2019 the brine was all in Chile with really high royalty costs. It also has really high reagent costs. Chile has also required giving a majority (51%) stake to Codelco to renew leases and have active disputes over other taxes, further eating into Chilean brine profitability.
But then the next chart shows that the brine has higher margin. How can it have higher margin if it has higher costs? Well, it's easier to have an integrated conversion facility to convert the lithium chloride concentrate into lithium carbonate on site. So if we look at the full costs from mining to lithium hydroxide/carbonate brine does really well.
S&P also is saying with the Greenbushes hydroxide numbers (which were theoretical as the conversion plants weren't build yet) that by avoiding shipping costs to China and capturing the conversion margin the total operations margin could be higher by vertically integrating. Albermarle owns 49% of Greenbushes and has built the Kemerton lithium hydroxide conversion facility to produce from Greenbushes spodumene concentrate. Tianqui and IGO together built the Kwinana hydroxide conversion plant to also convert ore from Greenbushes. Both conversion plants have been challenged by delays and cost overruns.
Lepidolite is lower grade and thus on a standalone basis higher cost compared to spodumene. However, many of the Chinese lepidolite mines are vertically integrated which allows saving on transport costs and gives a combined margin with the mining and conversion margin as one.
We also haven't mentioned sedimentary (clay) lithium like Thacker Pass or DLE brine projects like the Exxon and Standard in the Smackover or Erament in Centenario.
It's also worth keeping in mind that the cost curve from different research sources will come up with different numbers. Here's one from Citi for Western Australia hard rock producers.
When Will Producers Cut Supply?
— ᴀᴍᴀʟ ɪʟʟᴇꜱɪɴɢʜᴇ (@mineralsmindset) September 4, 2024
All major Australian #lithium mines are operating at a loss except for IGO’s [24.5% owned] Greenbushes mine. #Lithium prices will bottom in Q4 but ironically this is [based] on supply cuts. - Citi pic.twitter.com/hZpOdCHXg5
Some of this depends on what you are measuring. Benchmark has Pilbara Pilgangoora around $600/t but it's not clear what costs are included in that, are you comparing apples and oranges? Is that more comparable to Citi's production costs or should some of freight and royalties be included? I'll say the orange bars in Citi's cost curve seem more accurate to me than Benchmark's chart. Pilgangoora is a lower cost operation than Wodgina.
800 Pound Gorillas
In the middle of my writing this Rio Tinto made an acquisition bid for Arcadium.
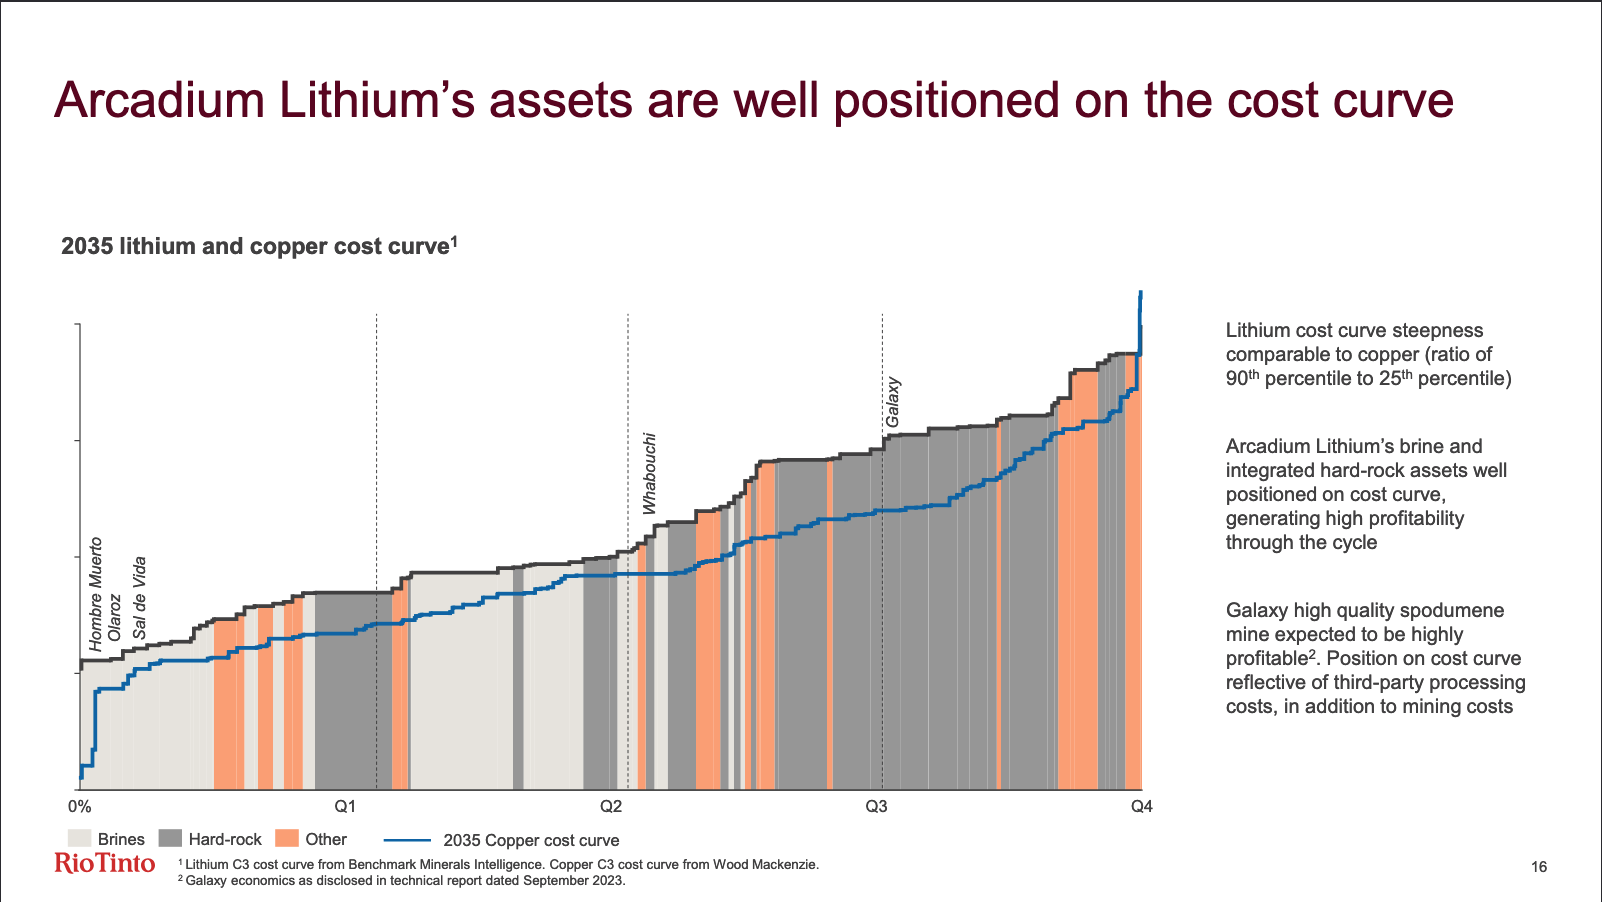
Argentina Brine
Some have touted that the acquisition is all about the first quartile cost Agentinia Brine, including unblocking their own Rincon lithium project with either Fenix (Hombre Muerto) tech or ILiAD (where Arcadium has a stake) tech. Those are indeed great assets.
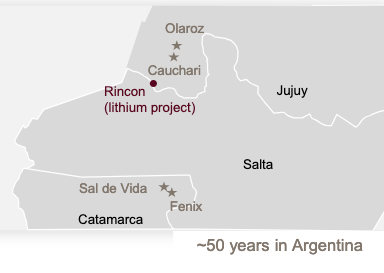
With Chile's current tax, royalty, and mandatory Codelco JV scheme Argentina brine is going to be the globally lowest cost way to lithium carbonate. Even if hybrid DLE is needed to deal with a high Mg/Li ratio. I define hybrid DLE here as what Fenix (Hombre Muerto) does with evaporation ponds to pre-concentrate and remove some minerals before an adsorption resin and resin strip wash phase that gets further concentrated in evaporation ponds to remove some of the wash water before final processing.
Super good thread on that at
Me reading the Rio Tinto - ALTM deal between the lines:
— DRAU (@drauwsy) October 13, 2024
Quebec Spodumene
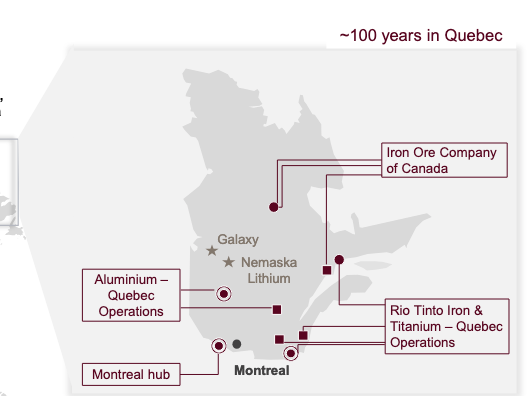
I want to add that Rio is also serious about the Quebec spodumene strategy as well. Here's a few items to support.
Critical Minerals Tax Credits
Rio has operations in Quebec and on both exploration and development there are a lot of tax credits available for lithium. It's in Rio's interest to get those tax credits and those credits improve the economics.
IRA
In order to get the full $7,500 electric vehicle tax credit in the US the battery has to be made with qualifying materials. Materials from Quebec and processed in Canada or the US would qualify. That means that you presumably could sell your spodumene concentrate, lithium carbonate, or lithium hydroxide for more here than you could sell the same product to China for.
RTEC partnerships
Before acquiring Arcadium Rio Tinto Exploration Canada (RTEC) was already partnering to explore for spodumene in Quebec. They have ongoing programs with at a minimum Midland Exploration, Azimut Exploration, and Saga Metals.
Jody Dahrouge runs Dahrouge consulting, a company actually running a lot spodumene exploration programs in Quebec. His Twitter account is great. I love his take.
Good point, doing deals with multiple juniors to tie up land across James Bay, spending millions to explore it, then purchasing Arcadium is a giant ruse. Which appears to have worked.
— Jody Dahrouge (@JodyDahrouge) October 14, 2024
Long History in Quebec
They already have operations for other metals (Iron/Titanium/Aluminum) in Quebec and have been in Quebec for 100 years, so it's a jurisdiction they are very comfortable with.
Hydroxide Diversification
While Brine may be the lowest cost path to lithium carbonate it's not as straighforward to lithium hydroxide. Spodumene has a more straightforward conversion path to hydroxide. Hydroxide is still the preferred chemical for high performance high nickel batteries.
Cost Curve Future
A napkin ranking of where the cost curve may settle in rank order.
Integrated Argentina Evaporation Brine
On an operating basis it's pretty hard to beat evaporation ponds and producing lithium carbonate on-site. Argentina has reasonable royalties and taxes. A lot of the ability to get capital in and out of the country at real exchange rates is also improving. I think these operations will eventually settle at the bottom of the cost curve on a total cost to carbonate/hydroxide. In no particular order in production or in construction projects:
- Lithium Argentina Cauchari-Olaroz
- Zijin Tres Quebradas
- Posco Sal de Oro (Hombre Muerto)
- Ganfeng Mariana
Development projects:
- Lithium Argentina / Ganfeng Pastos Grandes & Sal de la Puna
It's hard to get good data on Arcadium's Fenix (Hombre Muerto), which they call DLE but that also employs pre-concentration evaporation ponds ahead of the selective adsorption (SA) columns and further evaporation ponds to concentrate after the SA before the lithium carbonate plant. Eramet is also constructing a DLE plant at Centenario with little good information on operational costs. Will these have costs comparable to traditional evaporation pond operations or will their costs be significantly higher?
Chile Evaporation Brine
Chile has even higher lithium concentration and have more mature operations. However the tax, royalty, lease, and required majority given to Codelco makes the overall costs higher. Even with all that they are very cost competitive. All hail the Atacama, king of brines, even if the operators only see a sliver of the economics.
Western Australia Behemoths
Open pit wide spodumene with massive scale.
- Greenbushes
- Pingangoora
Minas Gerais Brazil
Cheap hydro electricity, a mining culture, good DMS recoveries, open pittable spodumene. Sigma has come in with CIF China costs below many existing Western Australia spodumene mines but due to high trucking costs to port and longer ocean shipping distances to China come in with total costs above Greenbushes and Pilgangoora.
- Sigma Lithium Groa do Cirilo (production)
- Atlas Lithium (construction)
- Latin Resources (development) being acquired by Pilbara
- Lithium Ionic (development)
Canada Development
Mostly Quebec in Canada and mostly James Bay in Quebec.
Quebec has predictable permitting, the grid electricity is mostly hydropower and is realiatively cheap. There's a skilled mining workforce. There is a culture of mining. There are tax credits.
More importantly there are a number of >100Mt >1% resources being discovered and developed. Many of them are amenable to Dense Media Separation (DMS) met. Most of them are open pits. Some of them are near roads.
It's pretty easy to name several development projects in Canada that are likely better than several existing mines in Australia.
Zimbabwae
Several Chinese companies have come in and built mines quickly. Because they aren't publicly traded western companies the viability into the mines costs are poor. They have long trucking distances to port with Zimbabwae being a landlocked country. But low labor costs and spodumene resources make them cost compeitive.
- Sabi Star
- Zulu
- Bikita
It's also worth saying that in Zimbabwae taxes, royalties, and export duties are a moving target so one profitable mine may find itself losing money just months later despite no changes in operations.
Western Australia Also-Rans
High labor costs and often remote but in a country with a good mining culture and rule of law. These are starting to be in the top half of the cost curve, but not the top quartile.
- Wodinga
- Mt Holland
- Kathleen Valley
The Right (Wrong) Side of the Cost Curve
We are in a lower price environment, so where are the production cuts coming from, and what patterns start to emerge.
Shuttering Marginal Spodumene Mines
Core Finiss suspending mining and then after working through stockpiles suspended producing spodumene concentrate and went to care and maintenance. This is a swing producer that could start up at higher lithium prices but won't operate at lower lithium prices.
Core had several problems. Their open pit resource had narrow veins. Their recovery rates came in under plan. Their BA33 underground was fundamentally higher cost.
Informal Sector
There are a lot of small individual miners in places like Zimbabwae or Brazil that mine spodumene and sell it through a network of shady brokers. However, they rely on high spot prices to survive as they don't have scale to get low costs or to justify a spodumene concentrator.
Loss Making Spodumene Mines
Sayona NAL is a good example of the high cost of mining narrow vein spodumene that has to be processed through flotation. One of two things will happen eventually, the mine will be shuttered or the price of spodumene concentrate will be higher.
In the last quarterly reported unit operating costs, which don't include corporate overhead and other costs, were US$995/dmt and they sold each ton at US$604/dmt). That's a -39% operating margin.
Bald Hill goes here. Kathleen Valley could end up here. Mt Catlin as it gets to end of open pit life and the strip ratio gets out of hand forcing them to go underground will end up here.
Lithium Tailings
Sigma as part of the dense media separation process had a fine tailings stream with 1.3% Li2O content. When prices were high they were able to put this on a ship for processing in China. As prices dropped these tailings were no longer able to be sold. It's likely these aren't the only lithium rich tailings that were being sold on the market.

Direct Ship Spodumene Ore (DSO)
Typically spodumene is mined and the head grade of the ore is 1%-1.5% LiO2 on average. It's then put through a concentrator and the concentrate has 5-6% LiO2.
Core Finiss started with Direct Ship Ore (DSO), Leo Lithium did the same, as did Liontown. As far I can can tell.
Petalite
Wishes it had the grade of spodumene.
Integrated Lepidolite
Vertical integration almost saves the grade and processing issues. But when I think swing producer this is it.
Non-Integrated Lepidolite
When I think of things that should never have been built, and only got built due to and unreasonable and unsustainable commodity price boom, this is it.


